Akton Psychrometric Suite V9 Industrial and Commercial Psychrometric Processes
The brand new Akton Psychrometric Suite V9 Windows desktop application has just been released in the spring of 2025.
Akton is based on the same code base as the popular HDPsyChart V9 desktop software tool, but is more focused on
very high and low temperature and pressure psychrometric processes for applications such as:
Akton is a powerful modeling tool that can be used to model a large variety of processes involving the thermodynamics of air water mixtures. Once a model of a system is created, it is easy to play out "what if?" scenarios. Solve complex problems using trial and error techniques.
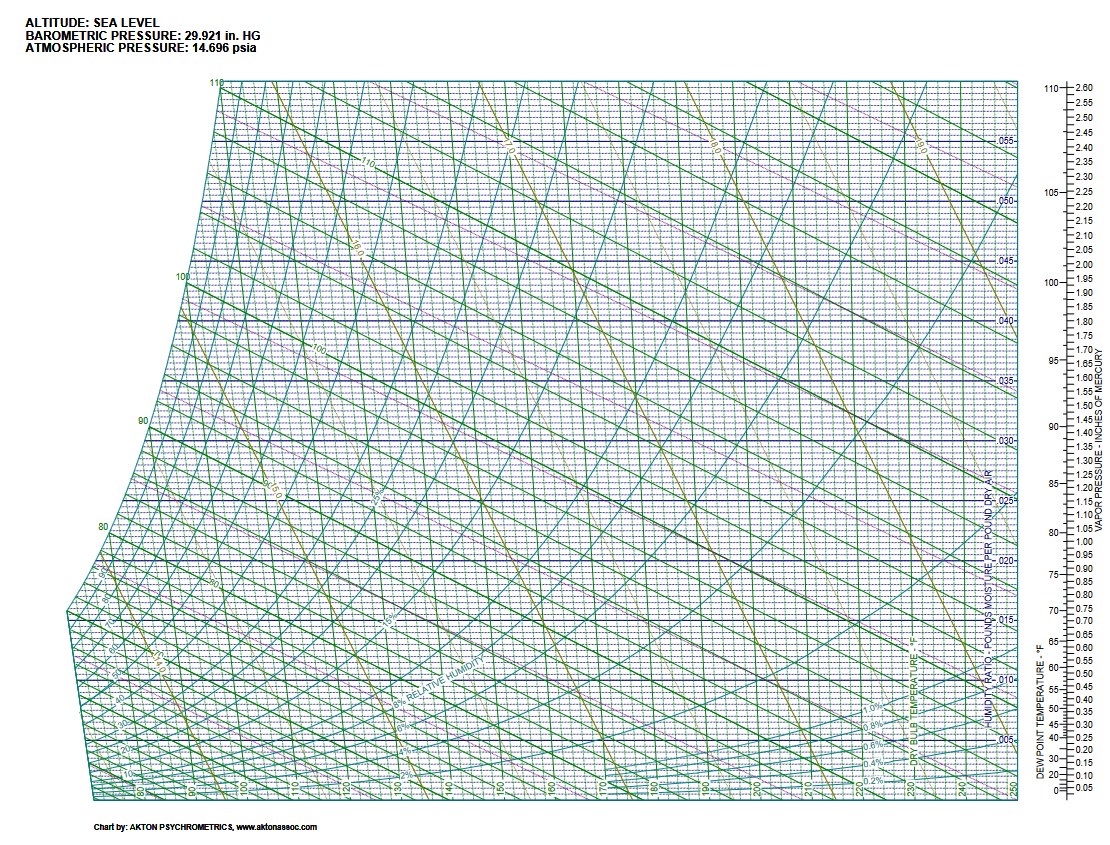
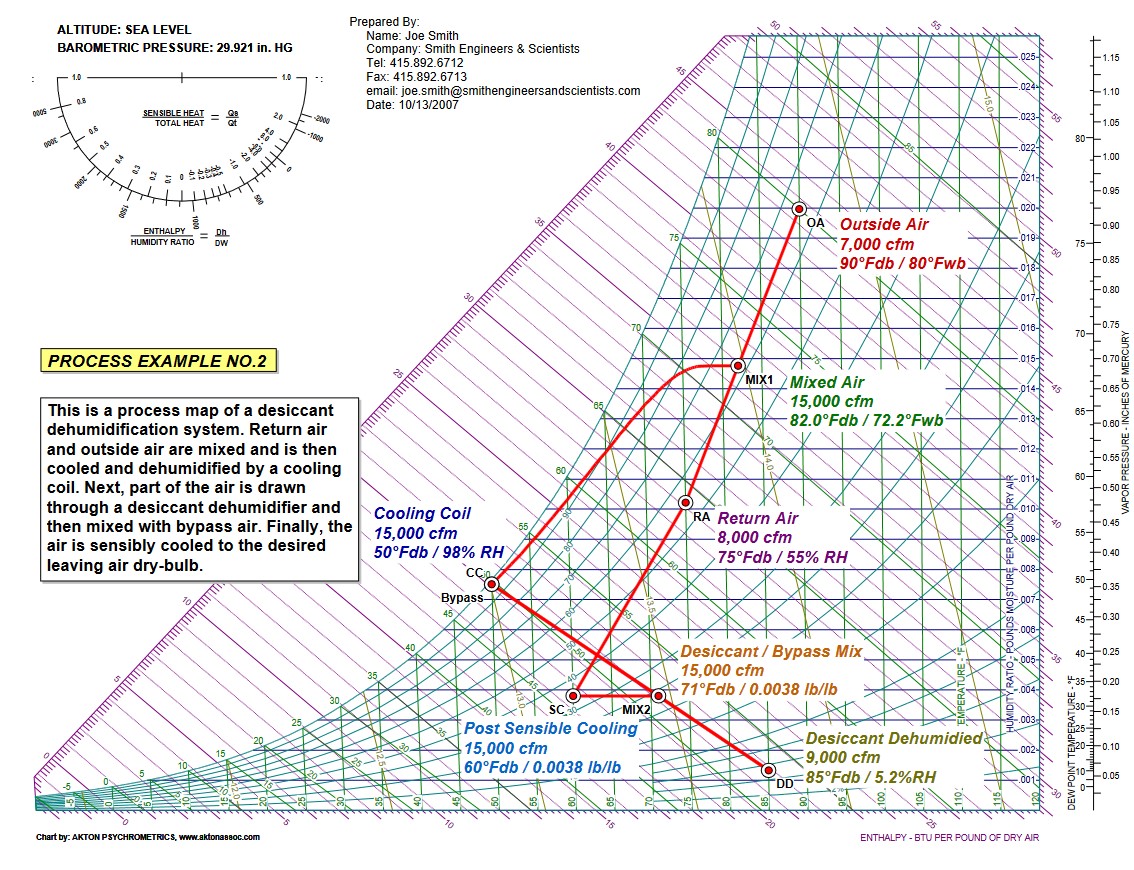
Akton dry-bulb temperature range is -100 to +2,000 °F, humidity ratios up to 1 lb/lb, altitudes up to 45,000 ft (pressure=0.2 psia) or pressures up to 100 psia ,both IP and SI units,and reports and charts in 13 different languages. Process modelling includes cooling coil with proper cooling coil curves, air mixing, desiccant dehumidification, evaporative cooling, sensible cooling, sensible heating and humidification.
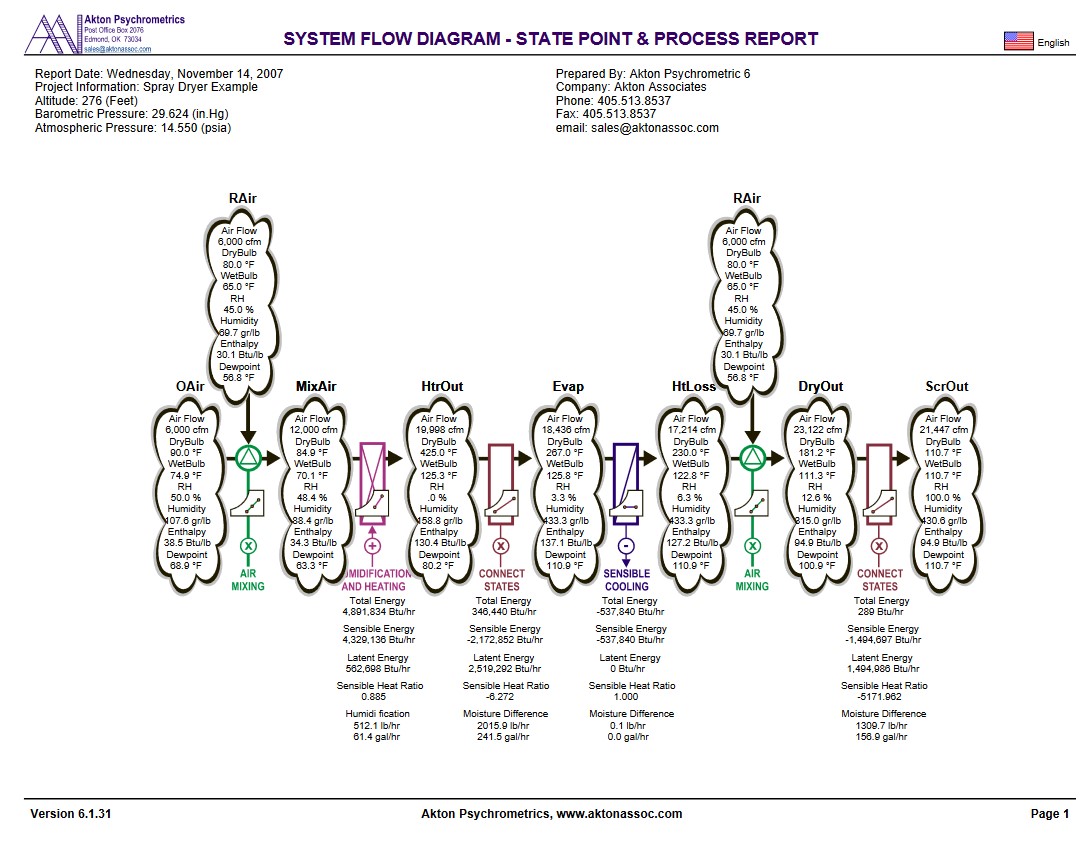
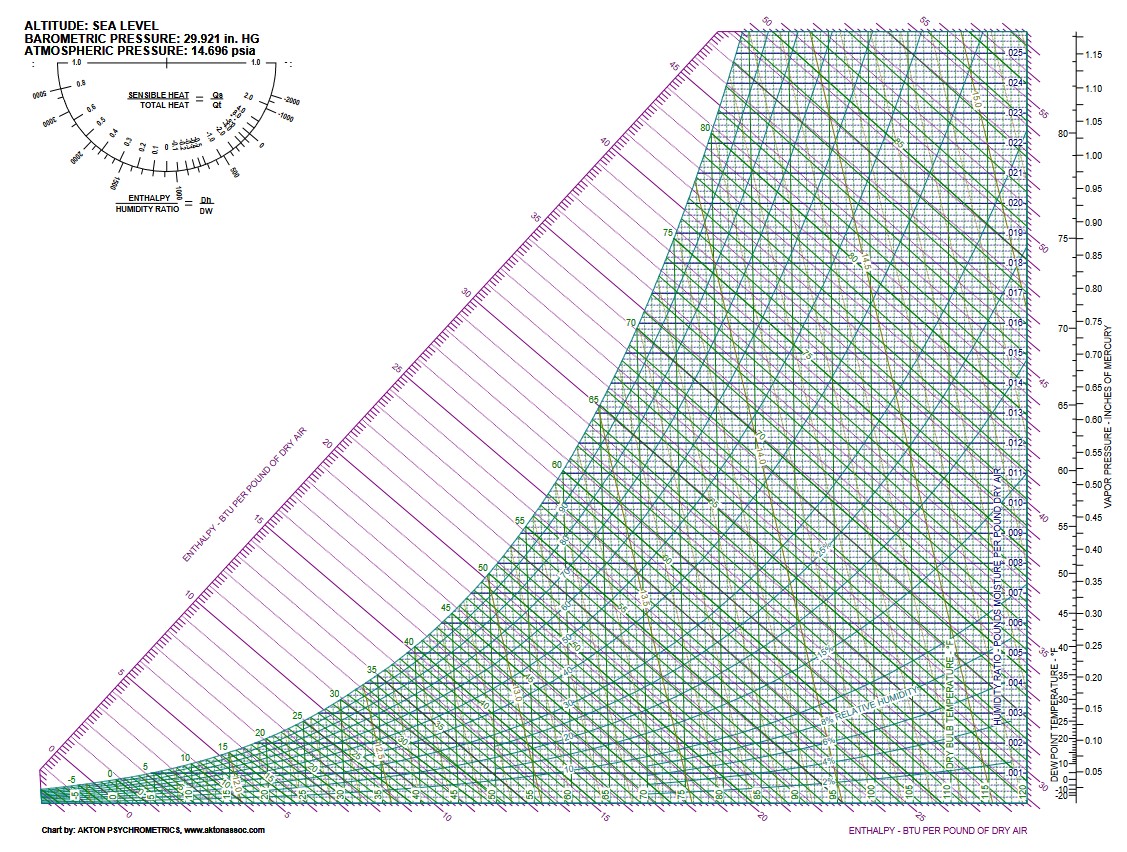
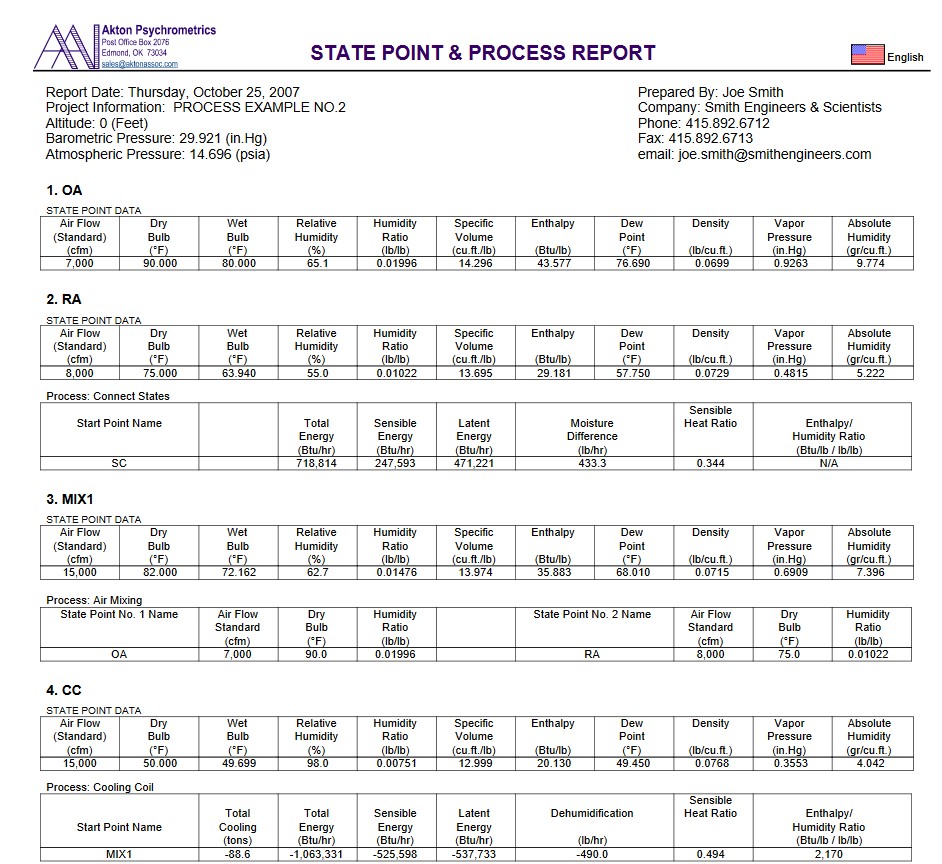
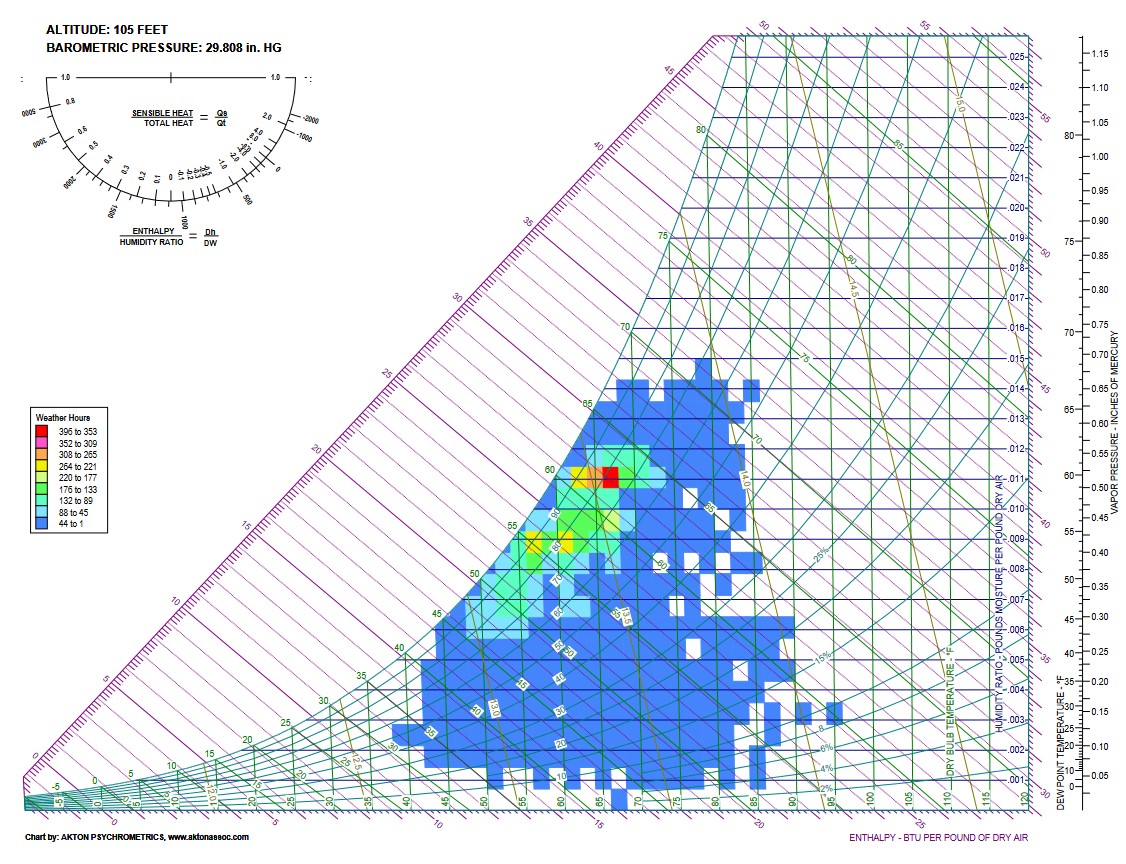
Akton also allows for complete psychrometric and process analysis, all graphically displayed on beautiful charts with unmatched accuracy. It also provides a professional state point and process report detailing all of the psychrometric and process values. Both IP and SI units are fully supported by Akton Psychrometric Suite.

- Agricultural Storage
- Drying, Food Processing, Dehydration
- Power Generation
- Chemical Manufacturing
- Petroleum Refining
- Primary Metals Refining
- Air Pollution Control
- Scrubber or Cooling Tower Evaluation
- Added ASHRAE data zones from the 2015 and 2021 “Equipment Thermal Guidelines for Data Processing Environments – ASHRAE TC 9.9 Reference.”
- Added world-wide ASHRAE climatic data from the 2017 and 2021 ASHRAE Handbook of Fundamentals. For 2017, weather data for over 8000 cities were added. For 2021, weather data for over 9100 cities were added.
- Added 2023 U.S. TMY3 weather data from the Climate.OneBuilding.org database that includes 8760 hourly data for 1000s of cities in the U.S.
- Added comfort data from ASHRAE Standard 55-2017 and 2020.
- Added additional ASHRAE ventilation data that includes data from ASHRAE Standard 62.1-2016 and 2019
- Includes a brand new feature called "templates" that allow you to store an unlimited number of psychrometric chart look-and-feels.
- For a complete list, click here.
Akton is a powerful modeling tool that can be used to model a large variety of processes involving the thermodynamics of air water mixtures. Once a model of a system is created, it is easy to play out "what if?" scenarios. Solve complex problems using trial and error techniques.
Akton dry-bulb temperature range is -100 to +2,000 °F, humidity ratios up to 1 lb/lb, altitudes up to 45,000 ft (pressure=0.2 psia) or pressures up to 100 psia ,both IP and SI units,and reports and charts in 13 different languages. Process modelling includes cooling coil with proper cooling coil curves, air mixing, desiccant dehumidification, evaporative cooling, sensible cooling, sensible heating and humidification.
Akton also allows for complete psychrometric and process analysis, all graphically displayed on beautiful charts with unmatched accuracy. It also provides a professional state point and process report detailing all of the psychrometric and process values. Both IP and SI units are fully supported by Akton Psychrometric Suite.
Process Analysis Capabilities
- ASHRAE Datacenter Zones to 2011 Thermal Guidelines
- ASHRAE 2010 Comfort Zones
- Re-arrange or Re-order Points on the Fly with One Button Click
- TMY2 & TMY3 Bin Weather USA Locations Added
- Ability to Select Days Per Week for Bin Weather Data & Plots
- HDClimatic data from 2009 ASHRAE Fundamentals
- Import Your Own Weather Data File Locations into the Chart
- Optional Process Directional Arrowheads on Process Lines
- Ability to Print-All or PDF-All (Psy+Flow+Report) into ONE File
- Cooling Coil Apparatus Dew Point (ADP) Calculator
- Cooling Coil Air Bypass Factor (ABF) Calculator
- Air Mixing Algorithm with both Mass and Energy Balance
- Auto Flow Chart Diagram
- Individual Process Line Color Control
- Individual Point Color, Shape and Size Control
- Winter "V" Air Mixing Capability with Condensation
- Fog Region Property Display
- Constant h, WB, HR, DB Line Control
Presentation Control
- Ability to Turn Logo On & Off, for ASHRAE Meeting “Generic” Presentations
- Customize Psychrometric Charts with your own Colors
- Change Any Chart Property Lines to Any COLOR You Choose
- Change Any Chart Property Lines to Any Line TYPE You Choose
- Change Any Chart Property Lines to Any Line THICKNESS You Choose
- User-Defined Custom Area Shading right on the Chart
- Updated ASHRAE 2010 Comfort Zones
- ASHRAE Class 1 through 4 Datacenter Zones (allowed & recommended)
- NEBS Datacenter Zones (allowed & recommended)
- Optional Process Directional Arrowheads on Process Lines
- Ability to Specify Weather Plot Data Point Colors
- Ability to Specify Weather Plot Data Point Size
- Ability to Hide State Point Label on a Point-By-Point basis
- Draw Your Own Lines Anywhere You Want
- Draw Your Own Ellipses Anywhere You Want
- Draw Your Own Rectangles Anywhere You Want
- Draw Your Own Circles Anywhere You Want
- Insert Your Own Pictures Anywhere You Want
- Humidity Ratio Unit of Measure Control
- Mouse Cross-Hair (Like CAD!!) or Target Control
- Cooling Coil Performance Line Control
- Page Color Control
- Chart Area Color Control
- ASHRAE Class 1 through 4 Datacenter Zones (allowed & recommended)
- NEBS Datacenter Zones (allowed & recommended)
- Black & White <=> Color Display & Print Control
- Heading On/Off Control
- Outline On/Off Control
- Zoom Window Control
Data Exchange
- Point Color Control when Importing Data from Excel (*.csv) files
- Point Size Control when Importing Data from Excel (*.csv) files
- Process Line Color Control when Importing Data from Excel (*.csv) files
- Process Line Thickness Control when Importing Data from Excel (*.csv) files
- Import Your Own Weather Data File Locations into the Chart
Additional Capabilities
- 20 Different Languages on Charts and Reports with one button click
- Note displaying capabilities
- Apparatus Dew Point (ADP) to Cooling Coil Leaving Air Calculator
- Air Bypass Factor (ABF) to Cooling Coil Leaving Air Calculator
- Point property toolbar display includes units of measure
- Thermal Comfort Terms Definition PDF Manual
- Air Density Property Calculation
- High Pressure Capability up to 100 PSI
- Auto-Altitude Change with Climatic Location Selection
- Fog Region Thermo-Physical Property Display